


Management dashboard give the user summary of: Income, Cost of Goods Sold (COGS), and Expense. Below actions are available under “Management Dashboard”:
![]() View management dashboard for the Accounts module e.g. Income, Cost of Goods, Expense
View management dashboard for the Accounts module e.g. Income, Cost of Goods, Expense
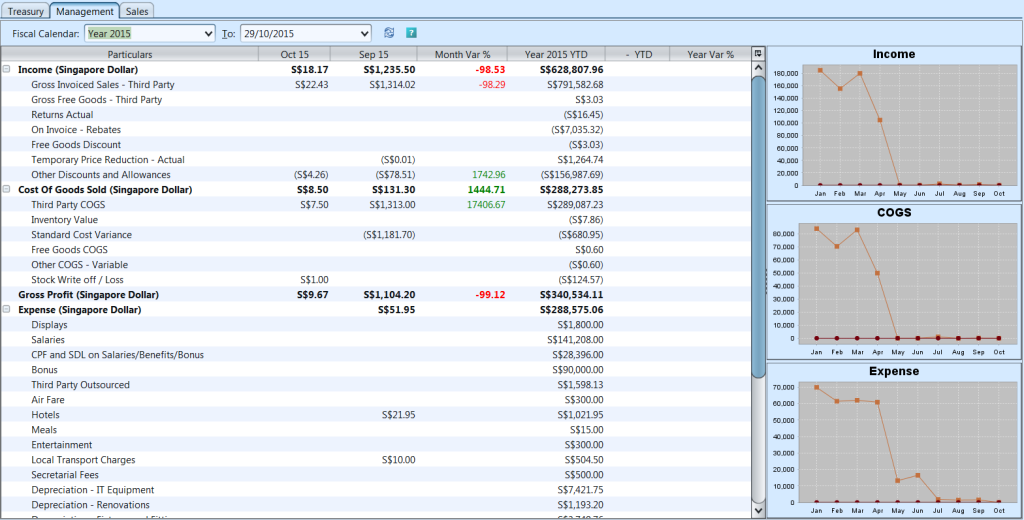
View Management Dashboard for the Accounts module
1. Select period of data to show by selecting fiscal year and date in “Fiscal Calendar” and “To” drop-down lists on top of the screen
2. Click on “+” or “-” button to expand / collapse the data view
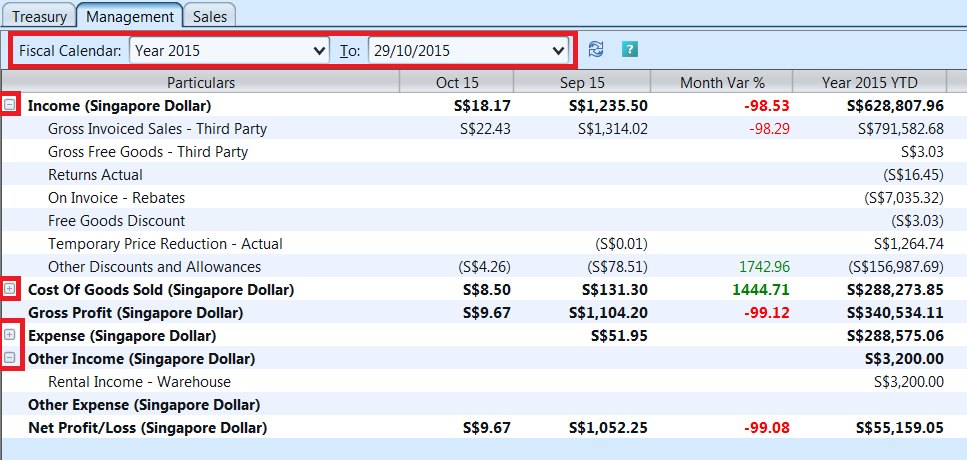
3. Click on ![]() button at the top of the screen to refresh the dashboard with latest data
button at the top of the screen to refresh the dashboard with latest data
4. Right click on a graph view, it will pop up the following options:
- Properties: user can change graph’s title and appearance
- Copy: copy the graph as image
- Save As: save the graph as image file (PNG format)
- Zoom In
- Zoom Out
- Auto Range