Sales Dashboard
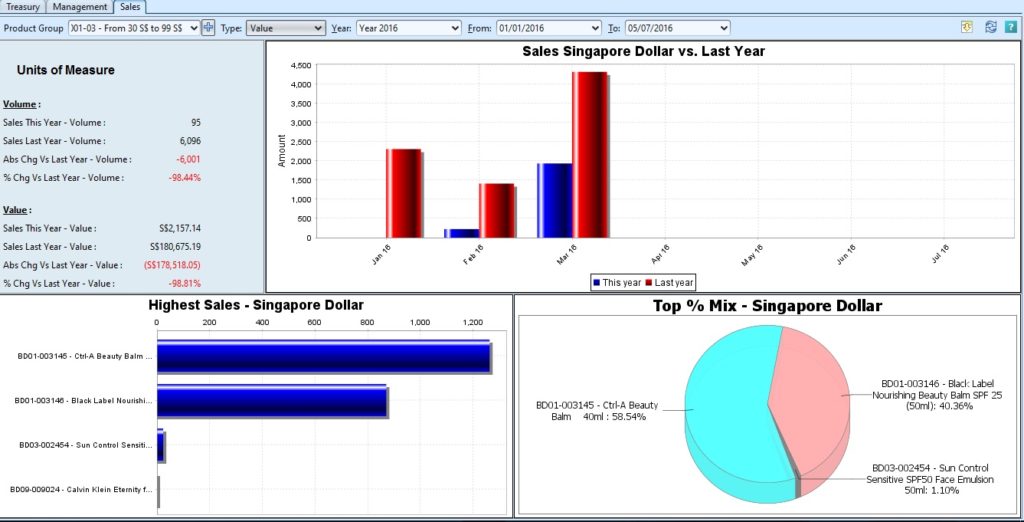
Sales dashboard give the user analysis of: Sales This Year vs Last Year, Highest Sales and Top % Mix. Below actions are available under “Sales Dashboard”:
![]() View sales dashboard for Sales module
View sales dashboard for Sales module
View Sales Dashboard for Sales Module
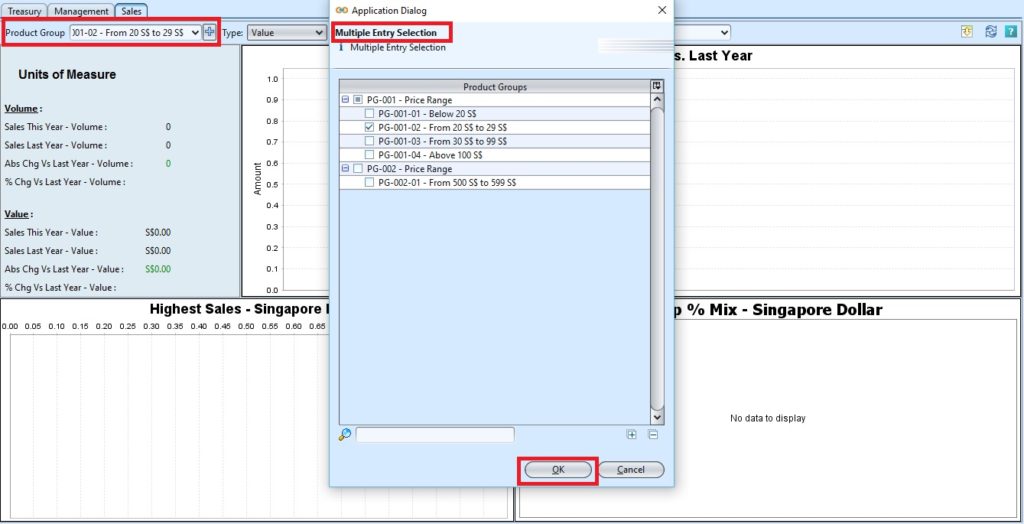
1. Select a “Product Group” from the drop-down list on top left of screen. Click ” ![]() ” button next to “Product Group” drop-down list to select multiple groups. On the pop-up window, tick the box(es) of groups to be included in the report, then click “OK” button
” button next to “Product Group” drop-down list to select multiple groups. On the pop-up window, tick the box(es) of groups to be included in the report, then click “OK” button
2. Select period of sales data to show by selecting fiscal year and dates in “Year“, “From” and “To” drop-down lists on top of the screen
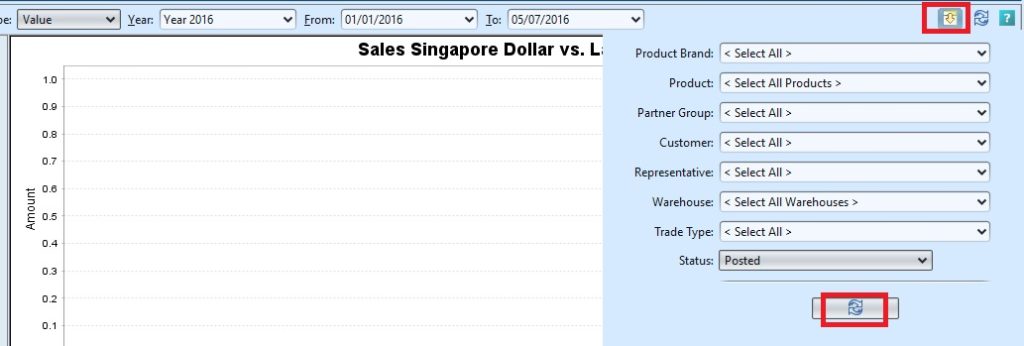
3. Click on ![]() button at the top right of the screen and select the parameters to filter the report, i.e. by specific “Product Brand”, “Customer”
button at the top right of the screen and select the parameters to filter the report, i.e. by specific “Product Brand”, “Customer”
4. Click on ![]() button at the top right of the screen to refresh the dashboard
button at the top right of the screen to refresh the dashboard
5. Select to view sales graphs data by volume or value from “Type” drop-down list at the top of the screen
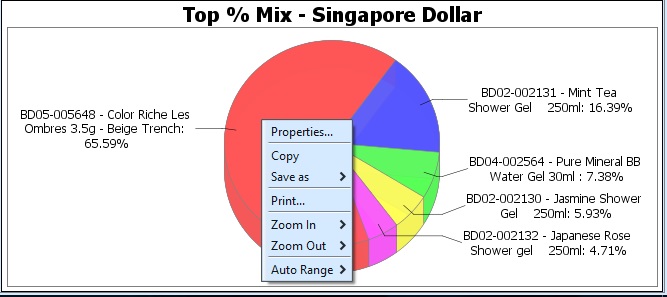
6. Right click on a graph view, it will pop up the following options:
- Properties: user can change graph’s title and appearance
- Copy: copy the graph as image
- Save As: save the graph as image file (PNG format)
- Zoom In
- Zoom Out
- Auto Range


