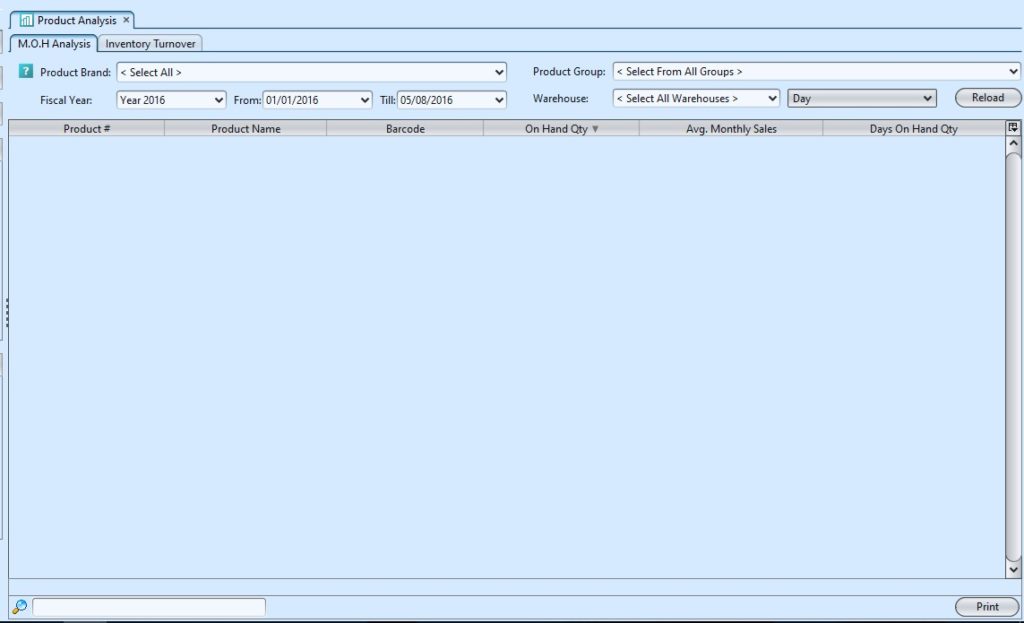
Product Analysis allows user to analyse products’ months on hand (M.O.H), average sales and inventory turnover data. Below are available actions for the user from “Product Analysis” :
![]() View and search for products’ average sales data
View and search for products’ average sales data
![]() View and search for products’ inventory turnover
View and search for products’ inventory turnover
![]() Print products’ analysis reports
Print products’ analysis reports
Product Analysis – M.O.H (Months On Hand) Analysis Field Names
Field Name |
Explanation |
Mandatory Information |
| Product Brand | Select a product brand or select all to view |
Y |
| Product Group | Self-Explanatory |
N |
| Fiscal Year | Self-Explanatory |
Y |
| From | Self-Explanatory |
N |
| Till | Self-Explanatory |
N |
| Warehouse | Self-Explanatory |
Y |
| Day / Week / Month | Select option to view period of on hand quantity |
Y |
| Product # | Self-Explanatory |
Y |
| Product Name | Self-Explanatory |
Y |
| Barcode | Self-Explanatory |
Y |
| On Hand Qty | Self-Explanatory |
Y |
| Avg. Monthly Sales | Self-Explanatory |
Y |
| Days / Weeks / Months On Hand Qty | Show products’ inventory quantity on hand by days / weeks / months view |
Y |
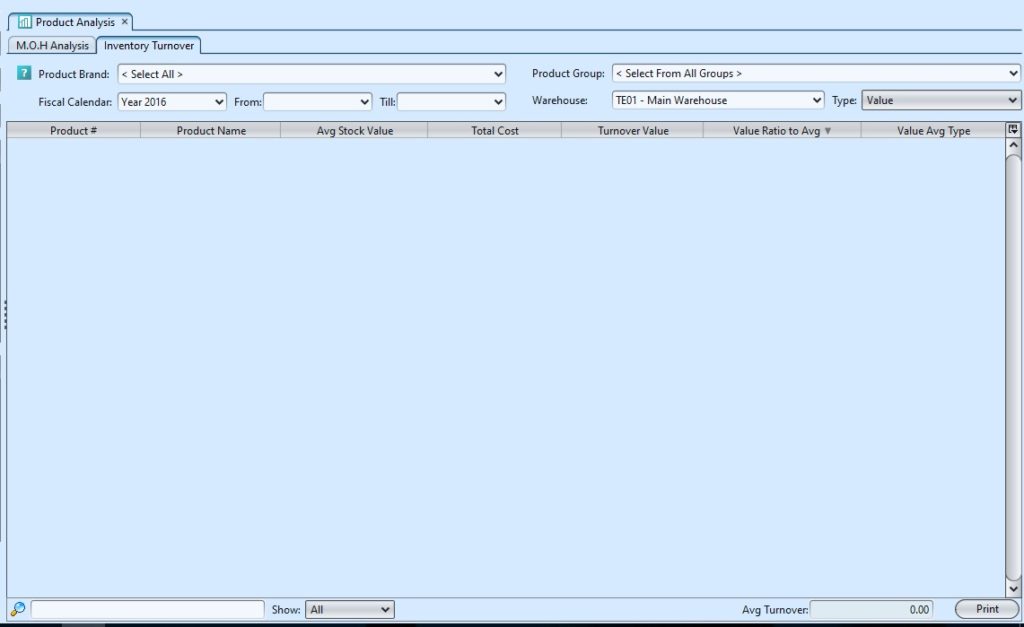
Product Analysis – Inventory Turnover Field Names
Field Name |
Explanation |
Mandatory Information |
| Product Brand | Select a product brand or select all to view |
Y |
| Product Group | Self-Explanatory |
N |
| Fiscal Year | Self-Explanatory |
Y |
| From | Self-Explanatory |
Y |
| Till | Self-Explanatory |
Y |
| Warehouse | Self-Explanatory |
Y |
| Type | Select to view data by quantity or value |
Y |
| Product # | Self-Explanatory |
Y |
| Product Name | Self-Explanatory |
Y |
| Avg Stock Value | Self-Explanatory |
Y |
| Total Cost | Self-Explanatory |
Y |
| Turnover Value | Self-Explanatory |
Y |
| Value Ratio to Avg | Self-Explanatory |
Y |
| Value Avg Type | Self-Explanatory |
Y |
| Show | Select an option to view inventory turnover data by its value average type |
Y |
View and Search for Products’ Average Sales Data:
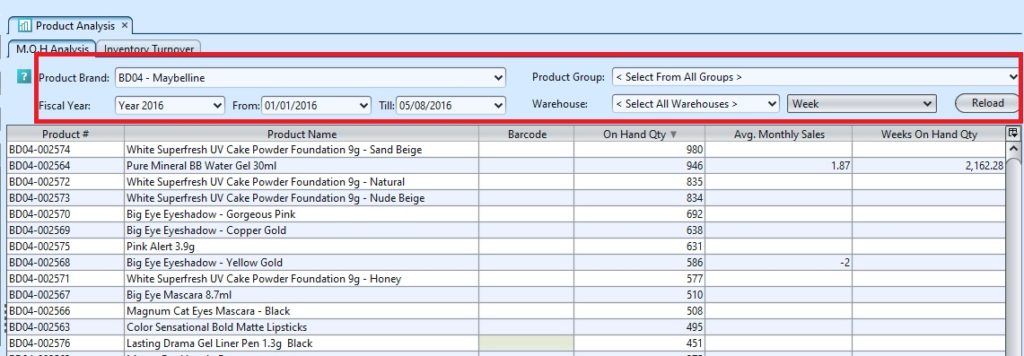
1. On “M.O.H Analysis” tab select a product brand from “Product Brand” drop-down list at the top of screen, user able to view all brands by choosing “Select All“. It will pull up the selected products’ average sales data
2. Select a product group in “Product Group” drop-down list to further filter the products’ average sales data
3. Enter year, from date and till date to further filter the product’s average sales data
4. Select a warehouse from “Warehouse” drop-down list at the top of screen to filter the result. User able to choose “Select All Warehouse” as well
5. Select Day, Week, or Month view for products’ on hand quantity
- Days on Hand Qty = On Hand Qty / Avg. Monthly Sales * 30
- Weeks on Hand Qty = On Hand Qty / Avg. Monthly Sales * 7
- Months on Hand Qty = On Hand Qty / Avg. Monthly Sales
6. Enter search parameter to filter the result, i.e. type in the product number in the search textfield box at the bottom of the screen.
7. Right-click on a product row, a small pop-up pane will appear with the following options:
- Show Product Details
- Show Product Register
- Show Product Ageing Register
View and Search for Products’ Inventory Turnover:
1. On “Inventory Turnover” tab select a product brand from “Product Brand” drop-down list at the top of screen, user able to view all brands by choosing “Select All“. It will pull up the selected products’ inventory turnover data
2. Select a product group in “Product Group” drop-down list to further filter the products’ inventory turnover data
3. Enter year, from date and till date to further filter the product’s inventory turnover data
4. Select a warehouse from “Warehouse” drop-down list at the top of screen to filter the result.
5. Select to view inventory turnover data by quantity or value data from “Type” drop-down list at top right of screen
6. Enter search parameter to filter the result, i.e. type in the product number in the search textfield box at the bottom of the screen.
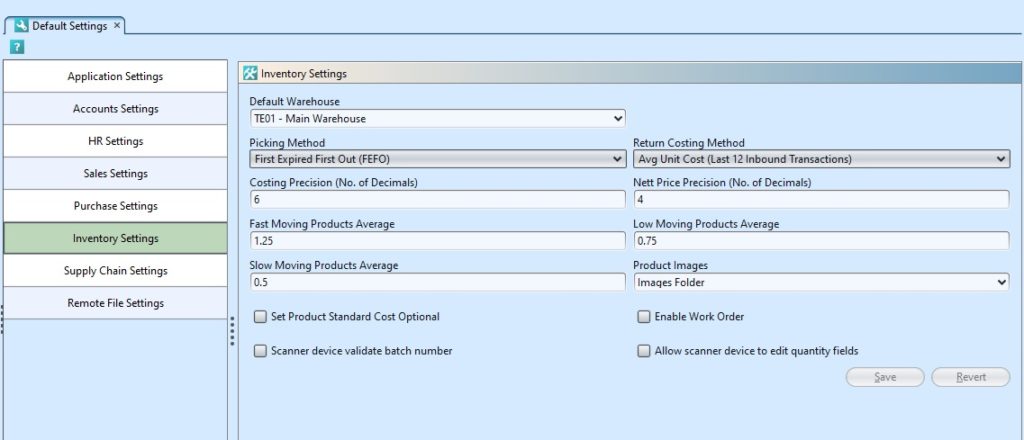
7. User can filter the product’s inventory turnover data to show only “Fast Moving“, “Low Moving“, or “Slow Moving”
Note: Products’ Average values are set in Organization – (Settings) Default Settings for Inventory module
8. Right-click on a product row, a small pop-up pane will appear with the following options:
- Show Product Details
- Show Product Register
- Show Product Ageing Register
Print Products’ Analysis Reports:
1. For products’ average sales report, on “M.O.H Analysis” tab select a product brand from “Product Brand” drop-down list at the top of screen, user able to view all brands by choosing “Select All“. It will pull up the selected products’ average sales data.
For products’ inventory turnover report, on “Inventory Turnover” tab select a product brand from “Product Brand” drop-down list at the top of screen, user able to view all brands by choosing “Select All“. It will pull up the selected products’ inventory turnover data.
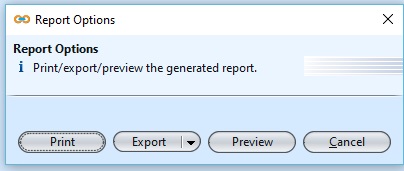
2. Click on “Print” button at bottom of screen, a window will come up showing print report options.
3. User can print report, export the report as pdf or excel, or preview the report


